home ![]() products
products ![]() pe explorer
pe explorer ![]() feature tour
feature tour
PE Explorer Disassembler
Win32 PE Disassembler: Dig into Executables
The PE Explorer Disassembler is designed to be easy to use compared with other disassemblers. To that end, some of the functionality found in other products has been left out in order to keep the process simple and fast. While as powerful as the more expensive, dedicated disassemblers, PE Explorer focuses on ease of use, clarity and navigation.
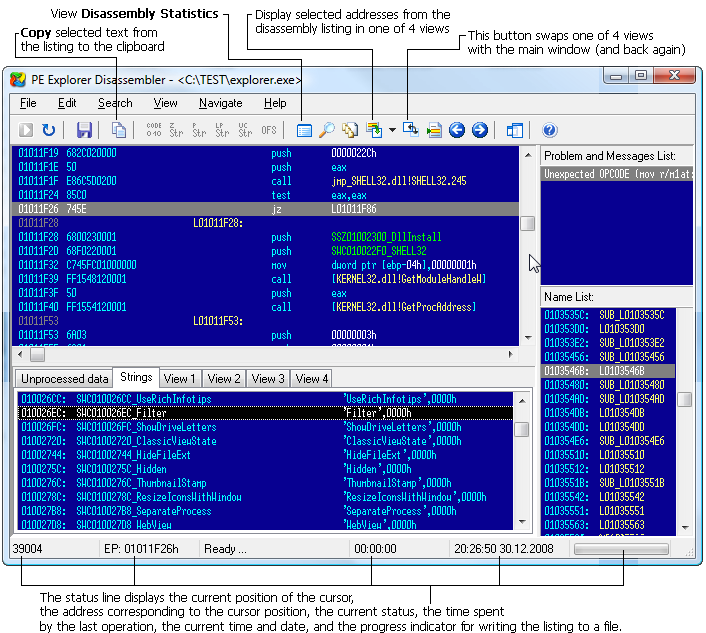
The Name List on the right-hand side displays a list of labeled addresses, including conditional and unconditional branching destinations, function prologues, named data, and string references. The disassembler highlights the entry point clearly for easy identification. To rename labels, simply press 'N' or access the "Edit | Rename Label" option.
In the Strings tab, you can find a compilation of detected strings. You can further manipulate string detection using the toolbar or menu items. For instance, you can mark strings as String, Pascal String, Long Pascal String, or Unicode by clicking on the corresponding options in the toolbar or by pressing 'S', 'A', 'L', or 'U', respectively. These features provide powerful tools for efficiently managing and analyzing strings within the disassembled code.
In the lower-left section, you'll find four tabs labeled View 1, View 2, View 3, and View 4, which can be accessed directly using the function keys F6, F7, F8, and F9, respectively. These tabs offer persistent disassembly views that are independent of the main view and are swappable, so you can easily switch between them as needed.
To manually mark code in the assembly listing, simply press 'C'. Likewise, you can mark Dwords by pressing 'D' and offsets by pressing 'O'.
For adding comments, press ';'. This allows you to include explanatory notes or annotations within the disassembled code for future reference or collaboration with others.
The Unprocessed data tab displays blocks of data that lack a reference to a specific procedure. This section can be valuable for identifying data segments that may require further analysis or categorization within the disassembled code.
The main disassembly view is located at the top-left section. You can adjust the spacing between each assembly line (using 'Ins' and 'Del' keys) and the number of opcodes displayed per line (using 'Shift + Ins' and 'Shift + Del' keys).
Navigation is really simple. To move to branching addresses, select the relevant line and press 'Enter'. For instructions with a second operand destination address, press 'Ctrl + Enter'. To backtrack to a previous address, use the 'Esc' key. To visit a specific address, press 'Ctrl + G' and input the address in hexadecimal format.
To list subroutines that might have references, select the starting address of the procedure and press 'R' or access "Search | References". A pop-up window will display the list of referenced addresses, which you can traverse by double-clicking on each listed address. This feature aids in efficiently exploring and analyzing subroutine references within the disassembled code.
We tried to achieve most of the power of IDA Pro, while requiring less skill or knowledge, by automating more of the disassembly process. We just made a good disassembler at a reasonable price. If your daily work involves reverse engineering of software and exploiting code, source code reviews, testing and evaluation of vulnerabilities, PE Explorer will save you hours of time and it's easy to use!
The PE Explorer disassembler assumes that some manual editing of the reproduced code will be needed. To facilitate additional hand coding, however, the disassembler utilizes a qualitative algorithm designed to reconstruct the assembly language source code of target binary win32 PE files (EXE, DLL, OCX) with the highest degree of accuracy possible.
The focus on accuracy ensures that the disassembled output closely resembles the original assembly code, aiding reverse engineers and developers in their analysis and potential modifications of the program.
The manual editing capability allows users to fine-tune the results and make necessary adjustments to the disassembled code to meet their specific needs or address any inaccuracies that might arise during the disassembly process. This combination of automated disassembly with manual editing capability strikes a balance between efficiency and precision, providing users with a comprehensive solution for understanding and working with binary win32 PE files.
![]() I've been using the PE Explorer for a while, and am very impressed with the latest version's functions -- especially the Disassembler.
I've been using the PE Explorer for a while, and am very impressed with the latest version's functions -- especially the Disassembler. ![]()
Zone Labs, Inc.
![]() One of the reasons that I bought PE Explorer was the Disassembler. Good stuff.
One of the reasons that I bought PE Explorer was the Disassembler. Good stuff. ![]()
Sun Microsystems, Inc.
![]() After using your tool vs. other shareware products I felt that I was getting the best deal for my $ instead of paying $400 for Ida Pro.
After using your tool vs. other shareware products I felt that I was getting the best deal for my $ instead of paying $400 for Ida Pro. ![]()
Intel Corporation
The Disassembly Process
The Disassembler (Ctrl + M, Tools | Disassembler) opens in its own window and overlaps the main interface, which can be toggled back anytime. The disassembler supports the most common Intel x86 instruction sets and extensions (MMX, 3D Now!, SSE, SSE2 and SSE3).
Before the disassembly process, the Options window (View | Disassembler Options) displays the following options:
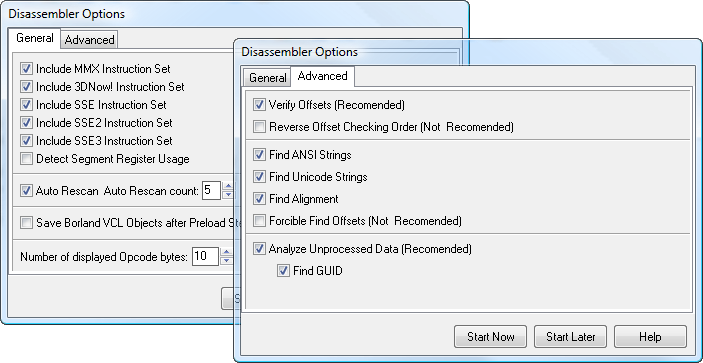
The checked Auto Rescan option and Auto Rescan count value are fine at default values, but for complicated binaries, they may require more passes. The number of displayed opcodes can be set to a default value.
Once you pressed Start Now, the disassembly process begins by identifying the compiler used to build the target file. Forehand knowledge of how a compiler puts files together improves the guesswork involved in determining the data allocation patterns within the target file. Moreover, given this information, identifying most of the objects, procedures, variables, types etc. of the target file can be achieved with a very high degree of accuracy.
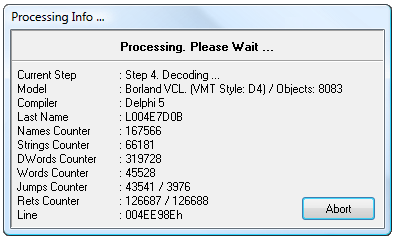
Only various Borland compilers are currently identified. The disassembler will decompile files built with other compilers too. At this time, however, it will only display specifically identified internal items for files compiled with Borland/Embarcadero compilers. During the disassembly process the Processing Info window displays the following information:
The fundamental challenge in disassembling compiled files is to correctly interpret the examined data. Separating code from data can be extremely difficult, especially when the initial code includes countermeasures intended to hinder disassembly. In order to meet this challenge, we developed a customized model, specifically designed to reduce incorrect data type identifications.
Although the customized modeling performed by the PE Explorer Disassembler does increase processing time, the result is a dramatic reduction of incorrect opcode translations. We think you will agree that that the extra time needed to achieve this high level of accuracy is justly compensated for by the time saved when hand correcting the output.
After the compiler has been identified, the disassembler searches the target file for a relocation table. If a relocation table is found, the information is used to detect the absolute offsets to the various content items in the file (for example: mov eax, offset L0041F46A, jmp L004A49FE). In turn, this information is used to form the Jumps list and the Rets list. The Jumps list stores the addresses to positively identified instructions and the Rets list stores the addresses to tentatively identified instructions. These addresses are then arranged according to the degree of certainty regarding their identification.
As the information from the Jumps list and the Rets list accumulates, the decoding process begins to emulate the execution of the code found within the target file. When the primary branch of the decoding process finishes executing, the remaining information from the Jumps list and the Rets list is processed. Information accumulated in the Jumps list is evaluated first, followed by the information in the Rets list, until both lists are empty. If the repeated scanning option is selected, this step is repeated until the disassembler has resolved any outstanding references.
The decoding process concludes by generating labels for any items that remain unidentified and setting the output positions for all of the various items found in the target file.
After all processing has been completed, the disassembler displays the resulting source code for the target file. This output can be manually edited or saved to disk for future reference.
Executable File Forensics: Search for Text Strings within an EXE
Searching through the strings within an executable file could be a way to get hints about the functionality of a program. With PE Explorer, you can try to fish out the strings that are present in the program, messages, something connecting to a URL, or copies of file that might be present at a specific location, etc. When you are looking for leads in the form of text, the output of strings found in the executable gives you a good knowledge of what some of the functions and subroutines called by this binary are.
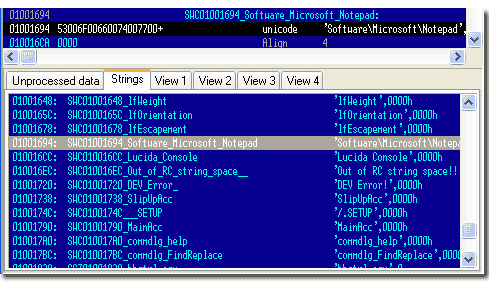
PE Explorer's disassembler efficiently retrieves ASCII text strings from the data portion of the file. Unlike other strings utilities that simply search and extract text strings, PE Explorer's approach is more precise and detailed. It extracts valid strings from specified memory locations, ensuring a higher level of accuracy in identifying meaningful information within the executable file. This feature greatly enhances the reverse engineering process, enabling users to gain a deeper understanding of the program's inner workings based on the extracted strings.
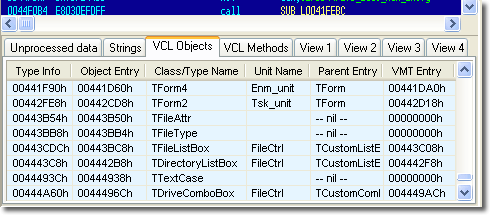
Search for Delphi VCL Obiects
The Delphi VCL object model is designed in such a way that we think it will be possible to reproduce the original assembly language source code perfectly. At Heaventools, improving the disassembler is an ongoing part of our PE Explorer development efforts.
Known Limitations
PE Explorer does not decompile code. It disassembles code, which is the task of converting machine code into assembler, but it does not generate C or C++ code from the disassembled output. Which is a task of great difficulty. Besides, in most cases, there is nothing in the executable that indicates what programming language was used to generate the program.
Disassembling files larger than 1 Mb in size can take several minutes depending on the capabilities of your system. Generally, each byte of a target file requires 40 bytes of memory for processing. For example, a 1 Mb file would require 40 Mb of processing memory, a 2 Mb file — 80 Mb and so on.
At this time, features in the disassembly implementation do not allow for producing source code that could be recompiled as is. File sections in which the physical size equals 0 and the data is located behind the boundaries of the physical size of the section cannot be accurately translated. The disassembler marks these items [DB Count DUP (??)] and does not place labels inside these areas. These kinds of sections arise because programmers often request memory and then fail to manage it properly, relying entirely on the operating system or the compiler to release the memory resources. For example (in Pascal):
Var MyData: Array [WORD] of Byte;
In this case, the space for storing the variable MyData will not be allocated physically in the data section, but the virtual size of the data section containing it will be increased by a WORD value. It also happens that variables declared in this fashion will result in lost megabytes of virtual space for the containing data section.
At present, due to the features of the internal data structures in PE Explorer and for the reasons cited above, mismanaged memory allocations are excluded from disassembly. Otherwise, the memory expenditure required to process target files could grow astronomically. Currently, each byte of incoming data requires 30-40 bytes of memory to process.
![]() Download a 30 day trial version of PE Explorer
Download a 30 day trial version of PE Explorer ![]() Buy the Full Version
Buy the Full Version
